


A. O. Smith Corporation
High-quality company in a stable industry

Contents of this article:
Key Facts - Summary
Business Overview
Fundamentals
Industry & Competitors
Governance
Valuation
Conclusions
1. Key Facts - Summary
Description
A. O. Smith Corporation (AOS) manufactures and sells water heaters for all kind of buildings such as residences, restaurants, hotels, office buildings, hospitals and schools. It operates in North America, China, Europe and India. The company was founded in 1874 and is headquartered in Milwaukee, Wisconsin, United States of America.
Fundamentals
Profitability (10Y avg.): 22% ROCE, 12%% ROA, 22% ROE
Financial strength: -11% debt/equity, 1.74x equity multiplier, 63.1x interest coverage
Growth: 5.0% 10Y revenue CAGR
Shareholder remuneration:
1.7% Dividend yield
-2% yearly share reduction in the last 10 years
Valuation
FCF yield = 4.5% ; P/FCF = 22.2 (FY2023)
Earnings yield = 4.2% ; P/E = 23.7 (FY2023)
2. Business Overview
A. O. Smith (AO Smith, AOS, the company) was founded by Charles Jeremiah Smith and it started as a supplier of metal components for manufacturers of baby carriages and bicycles. Through several generations, the company contributed to several technological advancements in the automobile revolution. In the mid-1930s, Smith engineers perfected the process of fusing glass to steel, leading to a series of new, glass-lined products such as beer kegs brewing tanks and residential water heaters. Its international expansion started in Canada (1962), and soon after Europe (1971), China (1995), India (2008) and Vietnam (2012) followed.
The company started its expansion to the water market in 1927. In 1948, it entered the market for coil-type instantaneous commercial water heaters and, in 1954, it introduced the first glass-lined commercial water heater. Fast-forward to 2011, the company sold its electric motor business and embarked on a strategy to become a leading global water technology company. Today, A. O. Smith serves the residential and commercial end markets with a broad range of products.
Water heaters: as the name implies, a water heater is a household device that is used to heat water that will be used for a wide range of daily tasks such as showering, cooking or doing the laundry. The company provides water heaters in sizes ranging from 40 to 80 gallon (151 to 303 liters) models, although it can also offer sizes as low as 2.5 gallons (9.5 liters) and as high as 2 500 gallons (9 463 liters). The company offers electric, natural gas and liquid propane tank-type models as well as tankless (gas and electric), heat pump and solar tank units. In 2021, it strengthened its position in Canada with the acquisition of Giant Factories ($198.6 million)

Boilers: AOS’ boilers range in size from 45 000 British Thermal Units (13 kWh) to 6.0 million BTUs (1 758 kWh). Boilers are closed loop water heating systems used primarily for space heating or hydronic heating (non-potable hot water).

Water boiler Water treatment products: AOS water treatment products range from point-of-entry water1 softeners, solutions for problem well water, whole-home water filtration products and point-of-use2 carbon and reverse osmosis products. AOS entered the water treatment market with the acquisition of Aquasana in 2016 ($87 million) and it expanded its product offers and geographic presence with the acquisition of Hague Quality Water International in 2017 ($44.5 million), Water-Right in 2019 ($107 million), Master Water Conditioning Corporation in 2021 (terms not disclosed), Atlantic Filter in 2022 ($9 million) and Water Tec of Tucson in 2023 ($16.8 million).
Other: AOS also manufactures and sells expansion tanks, commercial solar water heating systems, swimming pool and spa heaters, related products and parts.

AO Smith market its products with the following brand portfolio:
Water heater and Boilers: A. O. Smith Water Products (primary brand), American Water Heaters, GSW, Giant Factories, John Wood, Lochinvar, Reliance Water Heaters, State Water Heaters, Takagi, U.S. Craftmaster Water Heaters
Water treatment products: Aquasana, Atlantic Filter, Clean Water Testing, Clear Reflections, CustomCare, Evolve, Hague Quality Water, Impact Water Products, Master Water Conditioning, Mineral-Right, Water-Right, WaterCare, Water Tec
North America accounts for approximately 75% of the total sales, where AO Smith sells via wholesale distribution channel and retail and maintenance, repair and operations (MRO) channels. In the retail channel, AO Smith’s customers include four of the six largest national hardware and home center chains, including a long-standing exclusive relationship with Lowe’s. Water treatment products are sold through Lowe’s and Amazon and other e-commerce channels.

Most of the sales in North America correspond to water heaters, whereas boilers and water treatment products are a minority.
The remaining 25% of sales belong to Rest of the World, a majority of which are actually concentrated in China. The Chinese water heater market is predominantly comprised of electric wall-hung, gas tankless, combi-boiler,heat pump and solar water heaters that are sold in ~9 900 points of sale, of which ~4 600 are retail outlets in tier one through tier three cities and ~1 800 exclusively sell AO Smith products.
These geographical distribution also form the two reporting segments of the company: North America and Rest of World. The company’s North America segment sales are further disaggregated by major product line, whereas the company’s Rest of World segment sales are disaggregated by China and all other Rest of World.

As for now, the North America segment is more profitable than the Rest of the World segment, with ~25% and ~10% operating margin, respectively.
3. Fundamentals
3.1. Profitability
As explained previously, the sole source of AO Smith’s revenue is the sale of water heaters, boilers, water treatment products and related parts.
The cost of revenue is directly linked to the raw materials (mainly steel) needed to manufacture the products and the salaries of employees directly involved in the manufacturing process. In accordance with latest 10-K, a portion of AO Smith’s customers are contractually obliged to accept price changes based on fluctuations in steel prices.
Overall, gross margin has remained fairly stable in the last decade and lies between 35% and 40%. Since 2008, AO Smith’s gross margin has increased significantly, from 21% in 2008 to 38.5% in 2023. However, any data prior to 2011 is not representative of the company due to the strategic change and new focus of the company as a water technology company.
After subtraction of Selling, General and Administrative Expenses (SGA), which include labour costs but other expenses such as marketing, legal disputes or sale costs, AO Smith has an operating margin around 18-20%. In recent years, A. O. Smith has been on the higher spectrum of the range.
As we will see later, AO Smith does not have much debt, therefore the financial expense is quite low and does not significantly reduce operating income. After paying taxes, AO Smith’s final net margin is 12-14%.
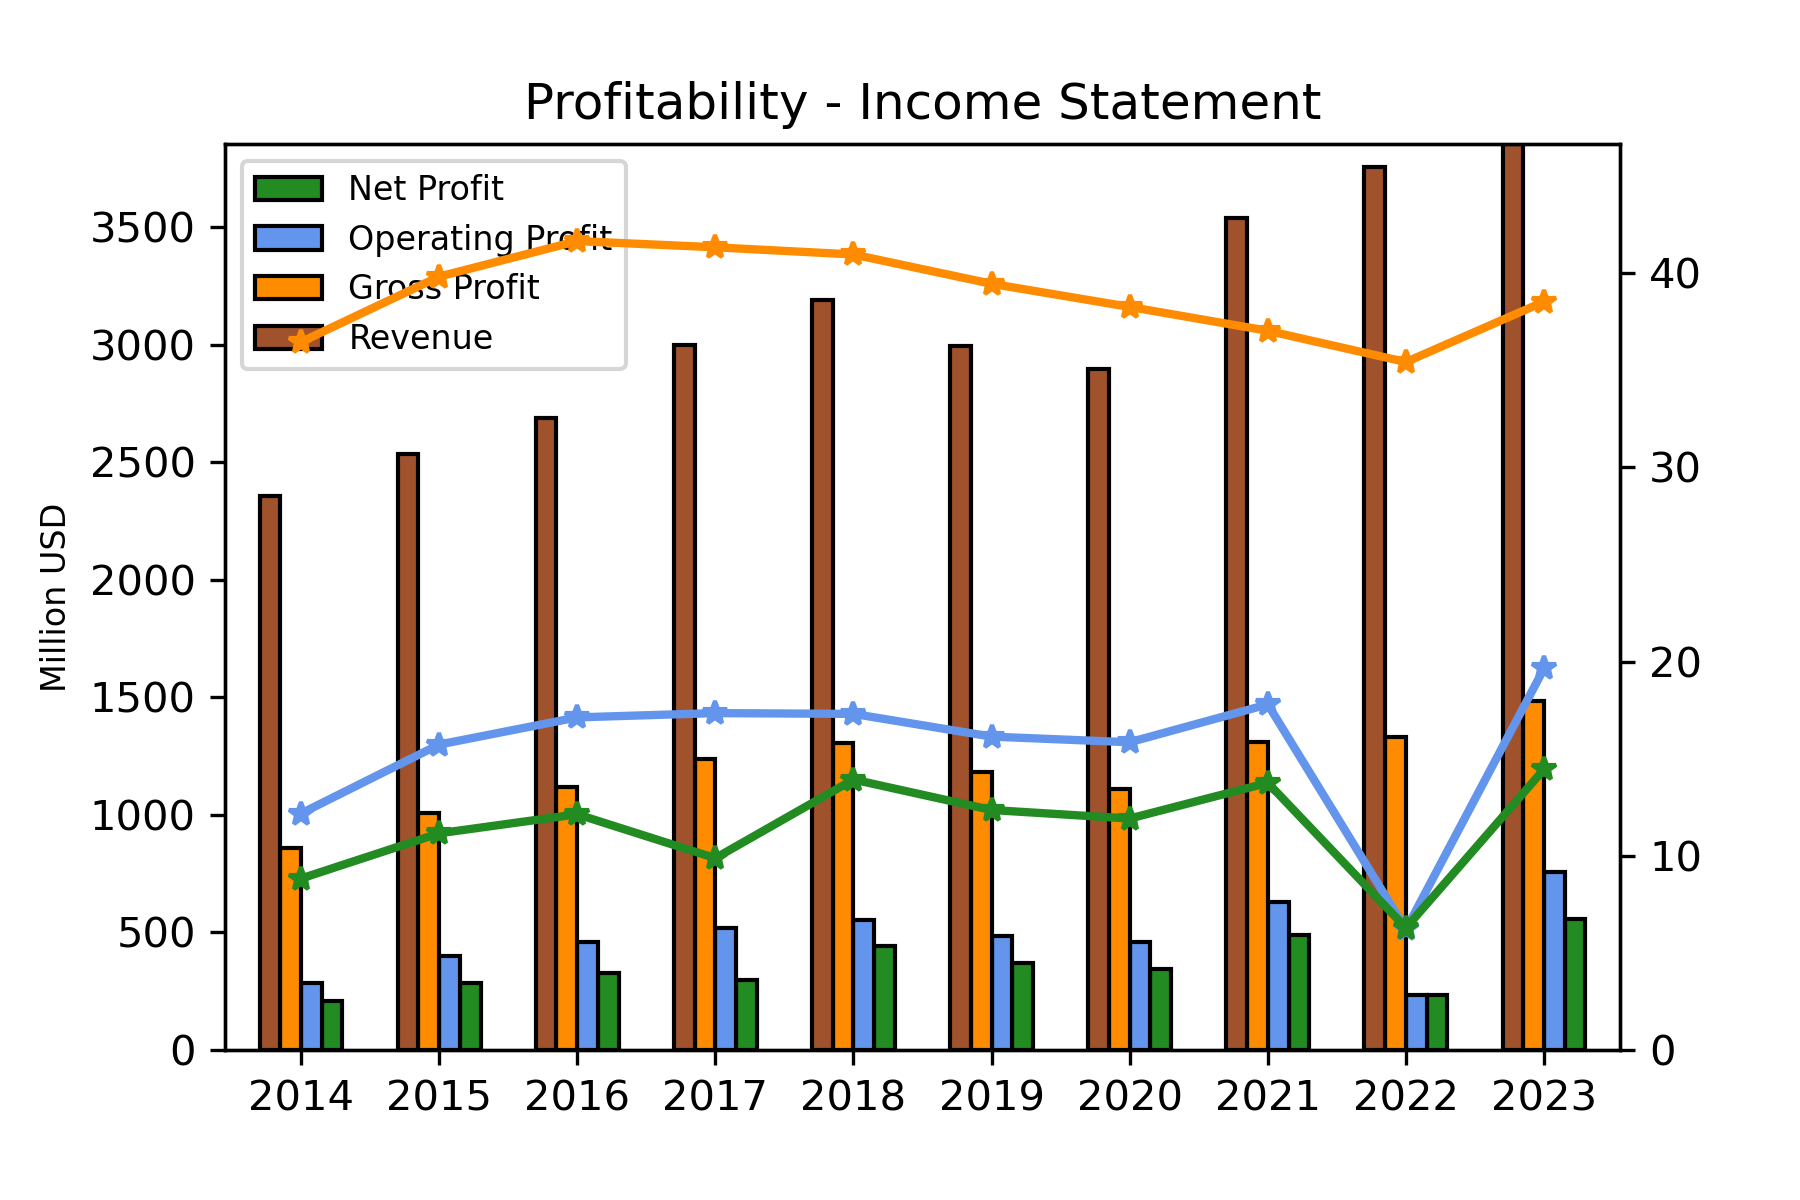
As we can see, there is an important reduction in profit in 2022. This is due to an extraordinary expense of $417.3 million linked to a one time pre-tax pension settlement because the Board of Directors approved the termination of the benefit pension plan in 2021. Without this extraordinary expense, margins would have been at the expected levels.
In order to operate as a business and manufacture and sell its products, AO Smith needs assets such as manufacturing plants, machinery, raw materials and technical expertise. For this reason, AO Smith’s balance sheet is a mixture of Property, Plant & Equipment (PPE), working capital and intangible assets:

Surprisingly, intangible assets and goodwill account for 30% of the total assets and 50% of the invested capital.
Property, Plant and Equipment (PPE): PPE is mainly comprised of land (2%), buildings (27%), equipment (61%) and software (10%) and accounts for 20% of the total assets and 33% of the invested capital.
Net Working Capital (NWC) is comprised of operating cash, receivables, inventory, receivables, etc. As a manufacturing company, proper management of the working capital is essential. A good sign is that AO Smith takes more days to pay its suppliers (days payable) than it takes its customers to pay AO Smith (days sales). However, there seems to be a clear regression in terms of the time it takes the company to turn its inventory into sales (days inventory). Overall, the number of days it takes AO Smith to convert its investments in inventory to cash oscillates between 20 and 40 days. Net Working Capital only accounts for 6% of the total assets and 10% of the invested capital.

Intangible assets are mainly customers list worth $112.4 million and trade names worth $224.3 million. As a result, intangible assets account for 10% of the total assets and 18% of the invested capital.
Goodwill is the result of several acquisitions performed in the last decades and accounts for 20% of the total assets and 33% of the invested capital. Given the strong M&A activity, goodwill is considered to be part of the invested capital.
Overall, considering the profit margins of the company and the assets it needs to sustain its operations, A. O. Smith is able to sustain an extraordinary Return on Capital Employed (ROCE) or Return on Invested Capital (ROIC).

For a very long period of time, regardless of the Return on Capital metric that we choose (ROCE, ROIC, ROE, ROA, etc), AO Smith’s performance has been undeniable. If we zoom in on the last decade, the Return on Capital metrics on a 3-year rolling average are very stable and always above the cost of capital:

AO Smith has had a ROCE and ROIC fairly stable at around 20%. I consider this to be an excellent performance for a manufacturing company with strong capital requirements. This also indicates that recent acquisitions have allowed the company to grow inorganically without dramatically reducing the ROIC due to goodwill.
3.1.1. Capitalising R&D expenses
As you will see in Section 3.3 Capital Allocation, the company invests a significant amount of capital into Research & Development. For this reason, it is recommended to adjust the financial statements in order to capitalise R&D. The logic behind the capitalisation of R&D expenses is better explained in the book Valuation - Measuring and managing the value of companies from Mckinsey (Tim Koller, Marc Goedhart, David Wessels):
When a company builds a plant or purchases equipment, it capitalizes the asset on the balance sheet and depreciates it over time. Conversely, when a company invests in intangible assets such as a new production technology, a brand name, or a distribution network, the entire outlay must be expensed immediately. […] failure to recognize such expenses as investments can lead to significantly underestimating a company’s invested capital and overstating its return on invested capital.
To get a more accurate measurement of ROIC, it’s best to capitalize outlays for intangible investments if they bring benefits over multiple years in the future rather than merely for the current year. Earnings in any given year are supported by not just that year’s R&D or brand advertising expenses, but instead by many prior years of these expenses.
R&D capitalisation is done by:
Capitalising and amortising the R&D asset, using an appropriate asset lifetime. Capitalising is done by choosing a starting year, as early as possible, and accumulating R&D Expenses as an “R&D Asset”.
Adjusting invested capital upward by the historical cost of the R&D asset, net of cumulative amortisation.
Adjusting NOPAT by adding back R&D expense and subtracting R&D amortisation in exchange for it.
Generally, a lifetime of 8 to 12 years for R&D assets is considered to be a reasonable assumption. As we can see, we have a slight decrease of ROIC and an increase on Invested Capital of around $500 million.

After capitalising R&D expenses, we can see that ROIC is reduced from ~25% to ~20% in the last 4 years, which is still remarkable.
3.2. Financial Strength
In terms of Financial Strength, AO Smith is in a very healthy position. The company is able to meet both its short term and long term obligations.

The Balance Sheet is not excessively leveraged and the equity multiplier (ratio assets / liabilities) has remained below 2.0x in the last decade. Additionally, AO Smith could theoretically pay its complete gross debt with one quarter if it decided to allocate all capital into debt repayment. In any case, this would not be really necessary because the company is currently in a net cash position of $208.2 million (leases included in the debt computation).
Altman Z-score, a proxy for the likelihood of bankruptcy, is 9.0, indicating that risk of bankruptcy is very low (Z-scores above 3 suggest a company is in solid financial positioning, while Z-scores close to 0 suggest a company might be headed for bankruptcy).
In 2023, AOS repaid $185.4 million of revolving credit agreement borrowings with an average interest rate of 5.3%. It also paid back commercial papers with an interest rate of 4.6%. Consequently, the company only has $127.3 million of term notes with insurance companies at an average interest rate of 3.1%.
Next scheduled maturities of long-term debt are $10 million (2024), $10 million (2025), $28.5 million (2026), $28.5 million (2027), and $13.2 million (2028). As a reminder, the company generated in 2023 around $600 million of free cash flow.
3.3. Capital Allocation
Thank to its low debt and high return on capital, AO Smith is able to cover its Capital Expenditures necessary to maintain operations and sustain organic growth and, at the same time, generously provide shareholder remuneration.


The figure below is quite dense but shows the yearly capital allocation and the different ways to calculate the reinvestment rates.

Organic reinvestment rate refers to CapEx and changes in net working capital, whereas the total reinvestment rate refers to the increase in total invested capital (i.e. including goodwill and intangible assets) and the retention ratio refers to the portion of earnings that are retained and thus not distributed to shareholders in the form of dividends.
One could think that a high retention ratio should be linked to a high reinvestment rate. However, since the retention ratio is calculated by dividing the increase in retained earnings by the net income, the discrepancy between the former and the latter is explained by the strong share repurchases done by the company.
Capital Expenditures
CapEx amounted to $72.6 million in 2023 and $70.3 million in 2022, in line with depreciation and amortization of $78.3 million and $76.9 million, respectively. Nevertheless, the company projected capital expenditures in 2024 between $105 million and $115 million. As of June 30, 2024, the company had allocated $44.9 million to CapEx, slightly falling short of initial projections.
Net acquisitions
M&A activity has been quite recurrent in the last decade, with the acquisitions of :
Aquasana in 2016
Hague in 2017
Water-Right in 2019
Master Water in 2021
Atlantic Filter in 2022
Water Tec of Tucson in 2023
Overall, around ~$470 million have been spent on net acquisitions, which is ~60% of the capital expenditures. This shows us that AO Smith is actively engaged and constantly searches for new opportunities for inorganic growth.

In a recent presentation for investors, AO Smith provided its latest capital allocation priorities and mentioned that M&A activity is based on “clear strategic filters and financial criteria”. The only criteria that we have are the following:
Strategic
Grow Total Addressable Market (TAM)
Capitalize on megatrends (whatever that means)
Expand geographically
New water themed platforms
Grow / leverage existing capabilities and technology
New or complimentary technology or innovation
Financial
Leads to an increase of EPS already in the first year
ROIC above cost ofo capital by the third year
Meet risk adjusted IRR hurdle rates
Accretive to growth or margin profile
I would personally appreciate more quantitative information as to what these strategic filters and financial criteria represent.
As most of the acquired companies were privately held at the time of purchase, it is very difficult to assess the price paid on a multiple basis. Additionally, the company does not report how these companies have performed in the years afterwards.

Research & Development
R&D expenses have been quite constant and, despite the different accounting treatment, they are worth highlighting. R&D amounted to $97.5 million, $89.0 million and $94.2 million during 2023, 2022 and 2021, respectively. These figures are similar for 2020, 2019 and 2018. Since 2013, the company has allocated more than $800 million in R&D. The company has an Innovation Hub in Milwaukee dedicated to the development of new energy efficient products and processes.
As previously seen, capitalising R&D expenses provides a more comprehensive view of the real ROIC and reinvestment ratio of the company.
Dividend payments
Dividends are part of the shareholder remuneration and AO Smith has a long history of dividend increases. In the last 10 years, dividend payments have increased at a 13% CAGR while maintaining a healthy payout ratio. The company has paid dividends for 84 consecutive years and has increased them for 32 years in a row. On the negative side, in the last investor presentation, the management states that they “conduct a peer analysis and assess yield / payout ratio”. Personally, this is an approach that I dislike, as the shareholder remuneration should not depend on what the company’s peers are doing and should rather be a rational decision on how to best allocate capital and create shareholder value.

Share repurchases
In addition, AO Smith engages in recurrent share buybacks as an additional measure to return capital to shareholders. The number of shares has decreased at a -1.85% CAGR since 2014. Combined with the current 1.6% dividend yield, it offers an overall shareholder yield of ~3%, although the final number of repurchased shares depends on the future volatility of the stock price.

The figure above is adjusted for stock splits. The company has done 5 splits throughout its history, in 1993 (2:1), in 1998 (3:2), in 2010 (3:2), in 2013 (2:1) and the latest in 2016 (2:1).
3.4. Growth
Although past performance does not predict future performance, it is always important to check how the company has behaved in recent years in order to have a baseline to predict future growth.
As we can see, AO Smith has had several periods in the past with negative growth. We cannot conclude that the company is recession-proof, given the fact that revenue fell significantly during the Great Recession and slightly the COVID-19 crisis. An hypothesis may be that private costumers and big businesses are less motivated to renew their own infrastructure during periods of crisis and are keen on trying to extend the lifetime of existing water heaters instead of having a quick replacement. A construction slowdown would also imply that there is less demand for AO Smith’s products.

If we focus on the last 15 years, we can see that revenue growth remained fairly stable. Since 2009, AO Smith had negative revenue growth in only 3 years and negative EPS growth in 4 years.
Contrary to what we would expect, most revenue growth is based on the North America segment, while the Rest of the World segment has remained flat for the last 5 years. More precisely, the North American segment has grown at a 7.4% CAGR, while the Rest of the World has decreased its revenue at a 4.0% CAGR.

Taking into account both organic reinvestment and acquisitions, A. O. Smith has a total reinvestment rate of ~15%. After capitalising R&D expenses, the adjusted total reinvestment rate increases to ~25%. Based on these fundamentals, should the capital allocation strategy and the ROIC/ROCE remain equal, we could estimate future earnings growth to be in the range of 5%. We can also estimate a sustainable EPS growth rate by multiplying the average retention ratio (~65%) by the average return on equity (22%), which gives us a sustainable EPS growth of 14%.
4. Industry
A good way of understanding a company’s business is to study who its suppliers, competitors and customers are. Other important factors are barriers to entry and substitute products. Overall, such analysis helps build a framework as defined by the Five Forces from Michael Porter.
Suppliers
The recent 10-K reports and Investor presentations do not provide much information on who are the main suppliers of A. O. Smith. As a general principle, the company needs raw materials (mainly steel) and logistics providers as basic suppliers.
In a Conflict Minerals Report from 2022, the company mentions that there are over 1 000 direct suppliers of materials and components. The objective of the report was to clarify the usage of 3TG materials (Tin, Tantalum, Tungsten and Gold) but provides valuable information on the number of suppliers:
The products we manufacture are complex, typically containing hundreds of parts from suppliers worldwide. We reviewed our supplier list for all manufacturing locations and eliminated service providers, equipment vendors, other non-manufacturing suppliers, as well as vendors with whom we spent less than $50,000 in 2022 and redundant listings for our multiple plants. Based on those criteria, we contacted over 1,000 direct suppliers of materials and components in 2022.
Customers
The end-customers / buyers of A. O. Smith’s products are homeowner and businesses, who acquire the products via retailers and wholesale distributors (e.g. Lowe’s, TrueValue, ACE Hardware, Do it Best, Ferguson, WinSupply, etc). In some cases, A. O. Smith has an exclusivity relationship with the retailers and distributors.
A. O. Smith’s sales are driven by two factors:
Replacement of existing equipment
Purchase of new equipment for new construction
As of today, 80-85% of sales correspond to the first group, which provides a source of recurrent revenue for the company:

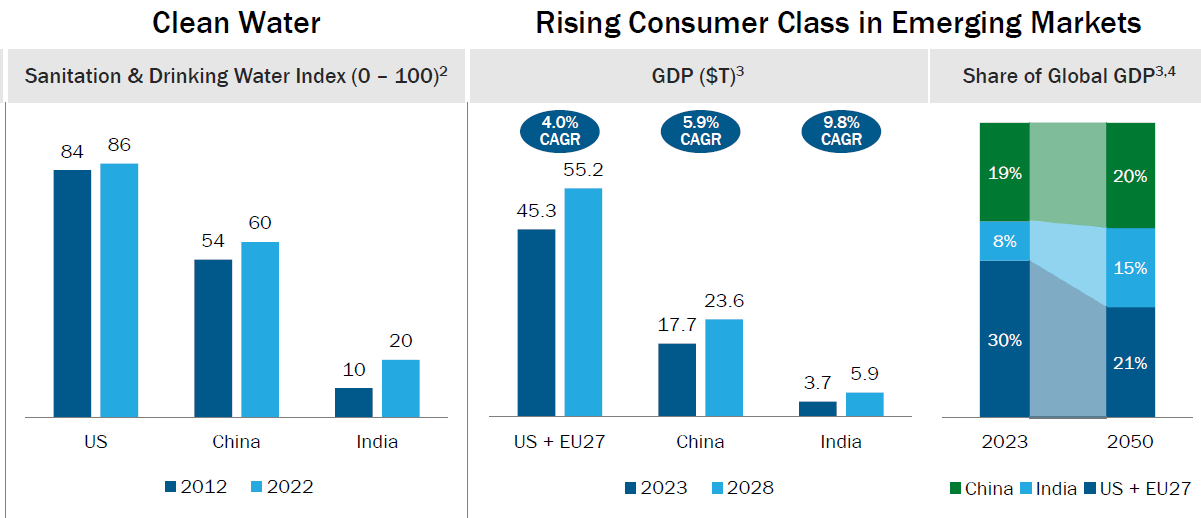
Given the fact that North America is already an economically developed area, sales will be supported by replacement of equipment, which provide stability and revenue growth in line with inflation but do not represent a source of extraordinary revenue growth (i.e. double-digit growth scenario).
For this reason, the company’s strongest growth opportunities are in China and India, where the rise of the consumer and middle class could trigger further demand for A. O. Smith’s water heating products. In such areas, the water treatment products offered by the company may also be of importance in order to improve sanitation and the quality of drinking water.
Competitors
In rare occasions, companies provide direct examples of their competitors. Fortunately, this is the case for A. O. Smith. According to their last 10-K reports, the company’s main competitors are:
Water heating and boiler:
North America: Rheem, Bradford White, Rinnai, Aerco, Navien
China: Haier, Midea, Rinnai
Water treatment products:
North America: Culligan, Kinetico, Pentair, Franklin Electric, Ecowater
China: Angel, Midea, Truliva, Xiaomi
Unfortunately, many of these companies are privately held and it is difficult to obtain information from them.
Regarding the water heater market, their most important product at the moment, , A. O. Smith has a 37% market share residential market and a 54% market share on the commercial market.
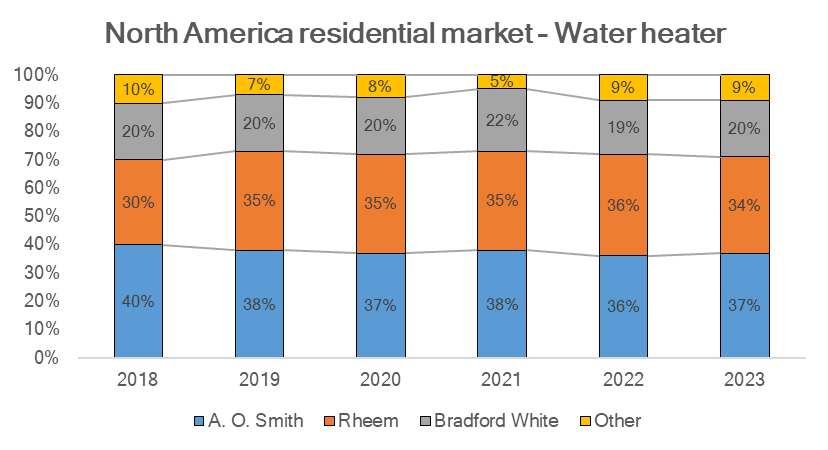

Barriers to entry / New entrants
As we can see above, market share has remained stable in the last years in the North America segment. This is typically a good sign and shows that the barriers to entry are high, especially considering the reduced number of companies in the market. As explained by Bruce Greenwald in his book Competition Demystified and by Michael Mauboussin and Dan Callahan in their articles Market Share and Measuring the Moat, stable market share leads to sustainable competitive advantage.
Market share stability is conducive to sustainable competitive advantage, whereas instability makes it more difficult to create value over time. Instability can be the result of multiple sources, including new entrants, competitive actions, technological change, and shifts in consumer demand. Market share instability provides insight into the nature of rivalry and is a measure of mobility within the industry.
However, we should remain cautious with the data as it only spans 6 years and does not cover multiple economical cycles.
Assuming that A. O. Smith and the other incumbents have a strong sustainable competitive advantage due to barriers to entry, what could be the source?
Economies of scale → A. O. Smith and the other two producers with the highest market share benefit from economies of scale. Producing water heaters in large quantities allows A. O. Smith to spread the fix costs and R&D expenses over more units, which gives the opportunity for either cost reductions or higher margins.
Switching costs → A. O. Smith may benefit from switching costs, as customers could be reluctant to change its water heater to another brand if they are satisfied with the product. However, I would not expect switching costs to be an important factor for A. O. Smith, as I do not think that customers are “loyal” to their water heaters (a water heater is not an iPhone) and the switch from one water heater to another does not impact customers’ daily lives. At the end of the day, we only need hot water to come out of the shower.
Network effects → A. O. Smith does not directly benefit from network effects in the same way that technology companies like Facebook or Google do. Network effects typically occur when the value of a product or service increases as more people use it. However, A. O. Smith may partner with large service providers and constructors that standardise their activities and use A. O. Smith’s brand by default for new water heaters and the subsequent replacements.
High capital investments requirements → While producing water heaters and water treatment products does not require as much capital as assembling airplanes or producing semiconductors, barriers to entry may be high due to strong requirements for capital (manufacturing plants, working capital) and technology (R&D expenses) for a new entrant to produce the same product at the same quality level. As regulation becomes more stringent and it becomes more difficult to comply with energy efficiency requirements, the current big players will have an edge over small new entrants.
Regulation
A. O. Smith is subject to regulation that sets the standards for the energy consumption of water heaters and boilers. The objective is to improve its efficiency in order to reduce their environmental footprint.
The Department of Energy (DOE) issued new efficiency standards for commercial water heaters and residential water heaters. The new standards for commercial water heaters will go into effect on October 6, 2026 and will require that only high-efficiency (condensing) gas commercial water heaters can be manufactured or imported into the United States on and after October 6, 2026.
The new energy conservation standards for residential water heaters will go into effect on May 6, 2029. The standards will help reduce the overall energy consumption in the United States.
Even if the end-customers are not obliged to do so, the new standards will promote the replacement of water heater and boilers to more efficient models. In accordance with this press release from the Department of Energy, there will also be tax credit and other incentives in order to promote such replacement:
Lowering Energy Costs for American Families and Businesses
President Biden’s Inflation Reduction Act also expands the accessibility and increases affordability of heat pump water heaters through tax credits, rebates, and other incentives, making it easier for families across the nation to switch to a more efficient model when deciding to replace a water heater—and benefit from years of utility bill savings as a result.
In anticipation of the new regulation, A. O. Smith is expanding its commercial water heater capacity in preparation for the 2026 commercial regulatory change.
5. Corporate Governance
5.1. Board of Directors
The company has two type of shares: Class A Common Stock and Common Stock. As long as the Common Stock shares are at least 10% total outstanding shares, Class A and Common Stock vote as separate classes in the election of directors. In addition, Class A Common Stock gets a vote for other matters, while Common Stock gets 1/10 of a vote for other matters.
Common Stock can elect 1/3 of the Board of Directors, rounded up to the next whole direct. Class A Common Stock can elect the remainder 2/3 of the Board of Directors. This remains valid as long as the Class A Common Stock is at least 12.5% of the aggregate number of Class A Common Stock and Common Stock.
As of February 29, 2024, there are 25.9 million Class A Common Stock (17%, 25.9 million votes) and 121.2 million Common Stock (83%, but 12.1 million votes), so both conditions are met in order for Class A stock to maintain its control.
In summary:
Class A Stock (96.9% held by the Smith Family Voting Trust)
Elects 6 Directors
Has 68% voting power for all other matters
Common Stock
Elects 4 Directors
Has 32% voting power for all other matters.
The Smith Family Voting Trust holds 96.9% of Class A stock and 0.9% of the Common Stock. Essentially, the company is controlled by the Smith Family and A. O. Smith can be considered as a family-owned business. In total, they own 17.8% of the company. The trustees of the Smith Family Voting Trust are Bruce Smith, Mark Smith and Robert Smith. Bruce Smith and Robert Smith are brothers and Mark Smith is their cousin.
The Board of Directors is composed of:
Class A Directors:
Ronald Brown (Age: 70, Director since: 2001) → Former Chairman and CEO of Milacron, Inc.
Todd Fister (49, 2024) → CFO of Owens Corning
Lois Martin (61, 2024) → Former President and CEO of Proto Labs
Ajita Rajendra (72, 2011) → Former Chairman of the Board of A. O. Smith
Mark Smith (62, 2001) → Former Business Manager of Strattec Security Corporation and trustee of the Smith Family Voting Trust.
Kevin Wheeler (64, 2017) → Chairman, President and CEO of A. O. Smith.
Common Stock Directors
Victoria Holt (66, 2021) → Former President and CEO of Proto Labs
Dr. Ilhman Kadri (55, 2016) → CEO and Director of Syensqo S.A.
Michael Larsen (55, 2021) → Senior VP and CFO of Illinois Tool Works
Christopher Mapes (62, 2023) → Executive Chairman of Lincoln Electric Holdings
Most of Directors belong to companies in the Industrial sector, with some representation from the Healthcare sector.
Stock ownership requirement for directors is five times the applicable cash retained received by the director in the last year (~$100 000 x 5)
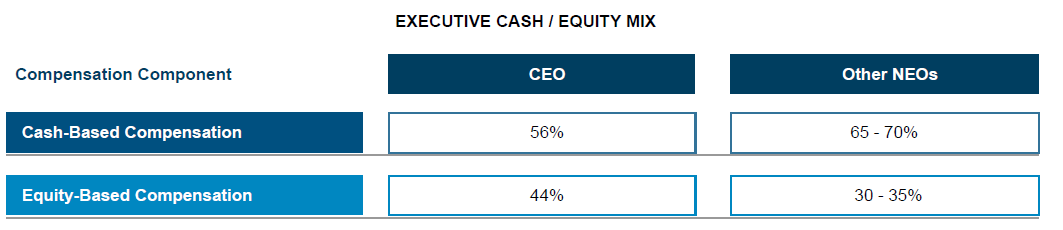
5.2. Executive Officers compensation
As usual, executive compensation is based on fix and variable cash payments and long-term equity compensation.
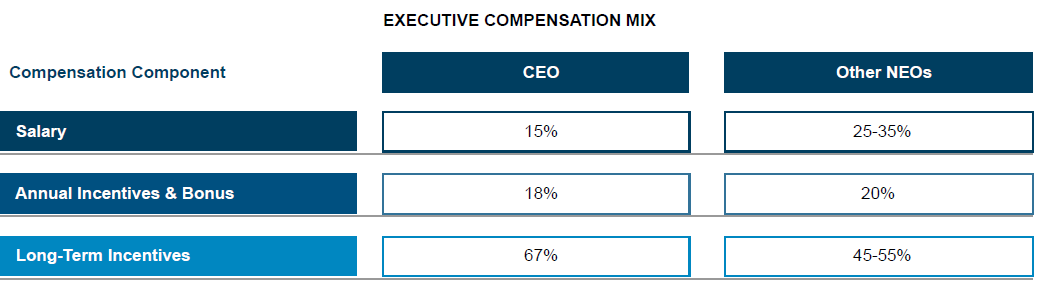
The annual incentive compensation is based on EBIT (80% of incentive) and net sales (20% of incentive) targets.
The long-term incentive compensation consists of restricted stock units (50%), performance cash (35%) and performance stock (15%).
Restricted Stock Units (RSU) are time-based, but have a minimum performance threshold based on a Return on Equity that must be achieved over a three-years period in order to vest. For 2023, the minimum average Return on Equity for RSU payouts was 5%. While I am not familiar with the compensation schemes of many of the companies in the S&P500, a Return on Equity of 5% seems way too low and not a real target.
Performance cash is dependant on ROIC performance over a three-year vesting period. Executives get 100% of the target is the company maintains the same ROIC as in the past 5 years. However, the company needs to maintain a ROIC that is 125% of the five-year average of the median ROIC for the S&P 500 Industrials index. The maximum payout is achieved at 225% of this reference point.

The Performance stock is based on how well the company reduces its greenhouse gas emissions, with a goal to reduce these emissions by 10% by the end of 2025. The executives get 50% of the maximum bonus with a 5% reduction, 100% of the bonus with a 10% reduction, and 150% of the bonus with a reduction of 25% or more.
In addition, executives are expected to hold an amount equivalent to 3 to 5 years of salary in common stock.

If we take into account that the median of the annual total compensation of A. O. Smith’s employees was $49 422 and that the annual total compensation for the chairman and CEO was $8 756 656, the compensation ratio is 177:1.
5.3. Shareholders and insider activity
As mentioned before, around 17% of the company is owned by the A. O. Smith family. Globally, all 23 directors, nominees and executive officers as a group hold 1.75% of common stock.
In addition, The Vanguard Group and BlackRock appear as main stockholders of common stock (surprise!) with a 11.60% and 8.20% ownership, respectively. State Street Corporation also has 6.04% of common stock.
Regarding recent insider activity, most of the trades are linked to the sale of shares, which is not necessarily a negative sign. There are plenty of reasons to sell a stock and in some cases it simply means that the executives want to turn their equity compensation into cash for private reasons. However, there has not been activity on the buy side neither. For this reason, we cannot derive valuable conclusions from recent purchases and sales.
6. Valuation
6.1. Reverse Discounted Cash Flow
As usual, the first exercise I like to perform when valuing a company is a reverse discounted cash flow analysis.
This helps me have an idea of what the market is already expecting for the company. Based on this, I can assess whether market expectations are too pessimistic or optimistic based on my own predictions.

Depending on the selected terminal growth rate, A. O. Smith is expected to grow its free cash flow from the current $598 million to $1000 - $1500 million (CAGR 5.7% - 10%) for a 10% cost of capital. In general, taking a terminal growth rate around 2% or 3% is common sense, implying a growth of free cash flow of around 7% to 8%.
We can check further in detail by splitting the projected free cash flow into the two main components of value creation: revenue growth and ROIC:

If we take a look at the graphs, A. O. Smith is expected to grow revenues at double-digit rates while maintaining a high Return on Invested Capital.
6.2. Earnings Power Value (EPV)
A second way of analysing the value of a company is to estimate ist current Earnings Power Value. The methodology is explained in the book Value Investing: From Graham to Buffet and Beyond from Bruce C. Greenwald, Judd Kahn, Erin Bellissimo, Mark A. Cooper and Tano Santos.
The approach is as follows:
Calculate an average operating margin over an appropriate period.
Multiply this margin by current sales or an estimate of average sustainable current sales. The result is an estimate of operating earnings. If necessary, adjust for non-cash costs such as excess depreciation and for unconsolidated operations
Calculate after-tax operating income (NOPAT)
Calculate EPV = NOPAT / WACC and adjust for cash and debt
As mentioned before, operating margins have been quite stable in recent years, around 17% and 19%, except for 2022 due to a non-extraordinary expense. During the first 6 months of 2024 this trend has continued an operating margin has been 20%. For this reason, I will take a sustainable operating margin of 18%.
Last FY sales were $3 853 million. In the first 6 months of 2024, sales are at $2 003 million. For the analysis, I will simply take the revenue from FY2023 as sustainable sales.
For A. O. Smith, we also do not need to adjust for unconsolidated operations.
With an average Tax Rate of 25%, we reach a NOPAT of $520 million.
Next, we should adjust NOPAT by excess depreciation. This means that we should use maintenance CapEx instead of accounting depreciation. There are two ways to do it:
Use years with no or very little growth as a proxy for maintenance CapEx. In this case, 2018 and 2019 were years of negative growth and CapEx amounted to $64 and $57 million.
Calculate an average sales/PPE ratio and calculate growth CapEx by multiplying revenue growth by the ratio sales/PPE. Substract growth CapEx from total CapEx and average out the value throughout several years. In this case, we obtain a maintenance capex of $57 million.
Based on the calculation above, we will slightly adjust NOPAT upwards by $20 million based on a reported depreciation of $78 million and total NOPAT will be $540 million, which does not make much of a difference.
With a cost of capital of 10%, the earnings power value is $5400 million. Adjusting by the net cash position, we get a total value of ~$5 500 million, which only accounts for 45% of the current market capitalisation.
In essence, this tells us that around half of the market capitalisation of A. O. Smith is allocated to the “future”, whereas the other half is allocated to the “present” of the company.
This ratio is quite at the border of where I feel comfortable.
6.3. Valuation - 2 scenarios
Since I am a person that struggles making a final decision, let’s keep playing and assess what would happen in three different scenarios.
6.3.1. Scenario 1 - Optimistic
A. O. Smith manages to sustain its recent 7% yearly growth on the North America segment
The Rest of the World segment catches up, especially in China and India, and A. O. Smith sees yearly growth of 10% in this segment.
A. O. Smith is able to sustain an operating margin of 20%. Note that this assumption is already optimistic, taking into account that, in this scenario, the Rest of the World segment, which is today less profitable, weights more in the overall revenue distribution and normally operating margin should go down in such case.
An exit EV/NOPAT multiple of 20x is taken, in line with current values. I consider such a multiple to be quite challenging.

This scenario gives as a CAGR of ~12% only via price appreciation.
6.3.2. Scenario 2 - Pessimistic
The North America segment slows down amid recession fear and it grows at only a 3% CAGR.
The investments on the Rest of the World segment do not work out and revenue remains flat, as it happened during the last years.
Nevertheless, the company still manages to maintain an operating margin of 20%. In this case, the assumption is not so optimistic as in the previous scenario because the Rest of the World segment does not gain weight on the revenue distribution and, therefore, the most profitable segment is able to sustain a high operating margin.
Due to these disappointing results, the exit multiple drops to an EV / NOPAT of 15x.

In this very disappointing scenario, we would actually not make any money and we would have no price appreciation!
7. Conclusion
Several conclusive remarks can be made after spending some time learning about A. O. Smith:
A. O. Smith has proven to be a reliable and high-quality company. Even when capitalising R&D expenses, the company is able to sustain a very high Return on Invested Capital in the range of 20% to 25%.
The company operates in a stable industry with little risk of disruption. Especially for the water heater industry in North America, the market has been shared by 3 o 4 key players and market share has been stable.
In addition, the financial strength of the company is undeniable and the balance sheet indicates that the company is at no risk of bankruptcy and is able to meet its financial obligations.
Capital allocation is focused on a mix of R&D expenses, organic reinvestment and acquisitions. In general, I prefer companies that are able to grow organically, as growth by acquisitions is prone to overpaying and to additional restructuring costs.
Shareholder remuneration is a common practice. With a combination of dividend payments and buybacks, the company offers a 3% to 4% yield.
Based on last FY, the company is trading at a PE of 23.7x, P/FCF of 22.2x and EV/NOPAT of 22.6x. Keeping in mind that the 10Y US Bond currently yields a not-so-bad 3.8%, these multiples do not represent a screaming bargain. However, taking into account the high-quality quantitative traits of the company, I would also not say that the company is extremely overvalued. In summary, the multiples simply seem “fair”.
Overall, I would be able to sleep at night holding shares of A. O. Smith. However, I have not decided yet whether I want to start a position on the company or if I should patiently wait for a gift from Mr. Market in the form of a 20% price drop.
Point-of-entry refers to the entry point within the home/building of the water supply.
Point-of-use: refers to the place where a product or a service is actually used (e.g. sink, shower, bath)
Nice write-up, impressive level of detail. If I can make a suggestion, I would say try to focus a bit more on the qualitative. What actually allows returns above the cost of capital for this business? Economies of scale are one thing, but they exist almost everywhere - why is this company specifically able to earn almost 30% on net unlevered assets? I think this is the single most important thing to think about when looking at a company.